Form Data Reports
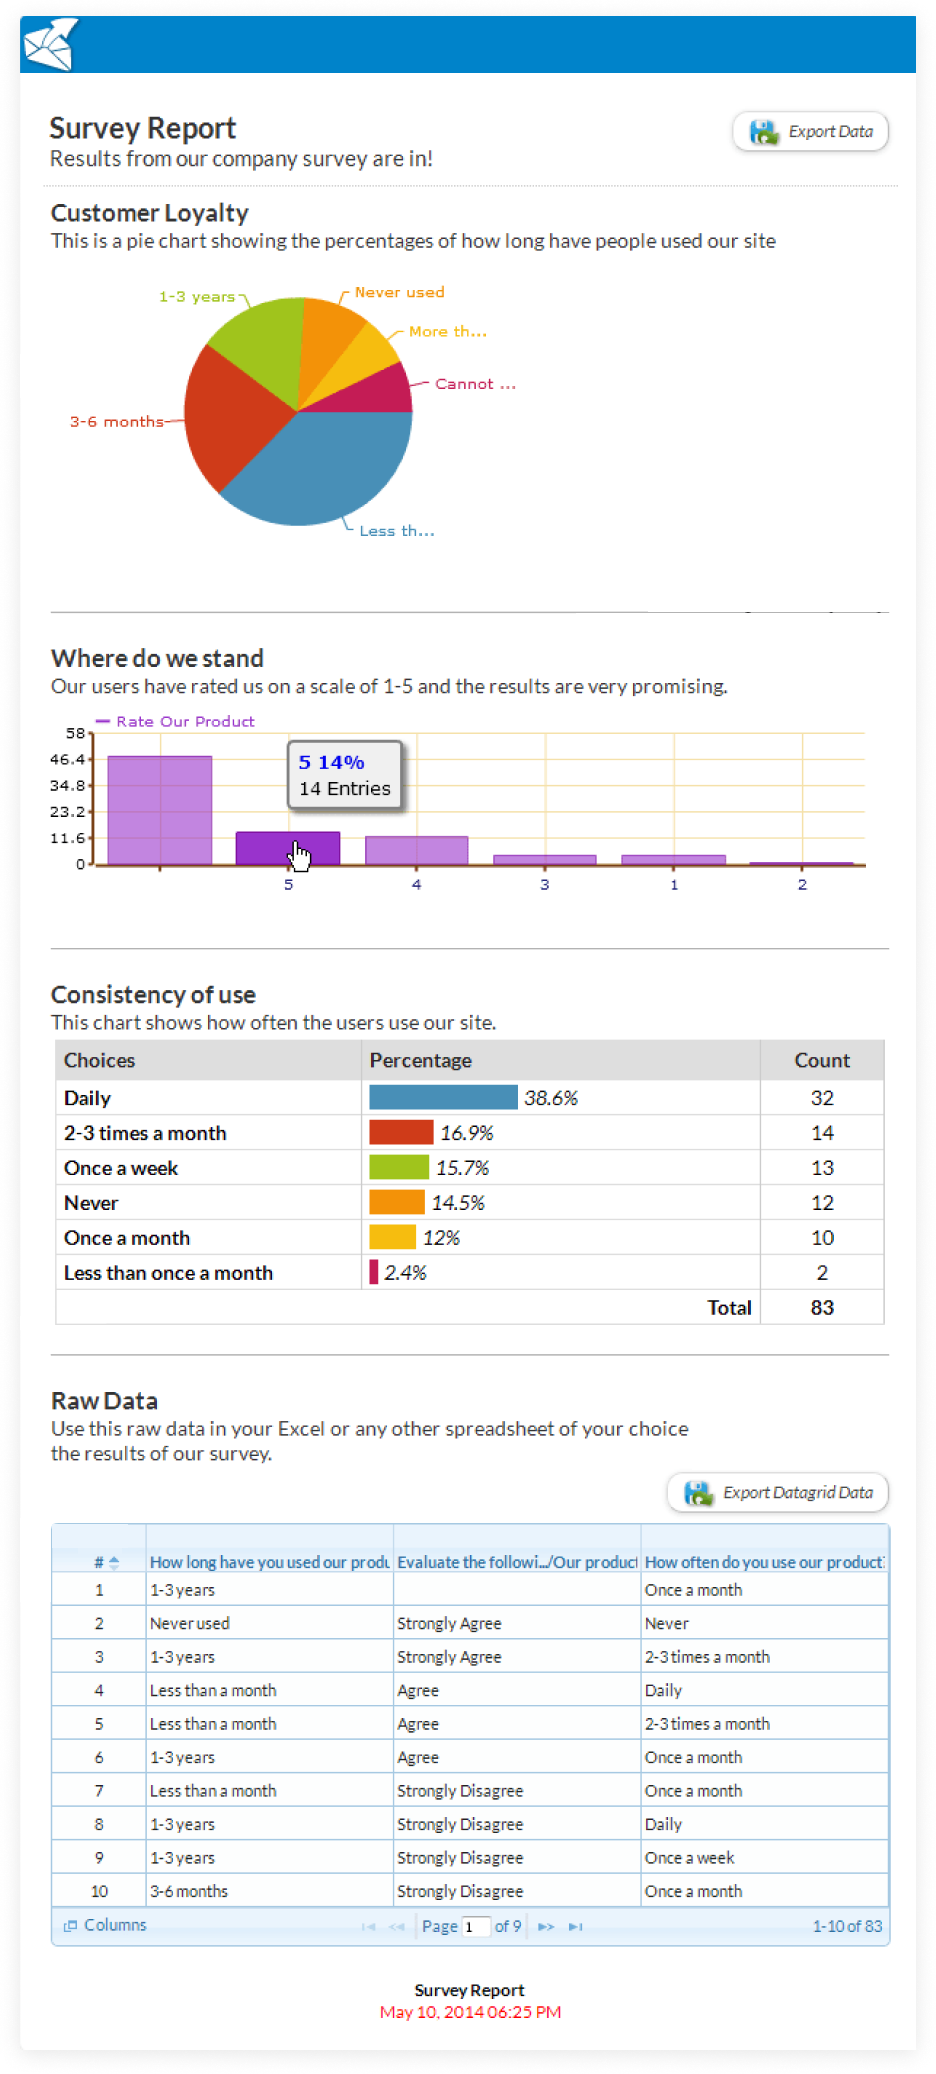
Easily make sense of the data you collected using your forms. View the summarized data in various formats such as charts, graphs, and grids. Customize your survey reports according to fields, titles, descriptions, and other relevant data you select.
Customize your reports
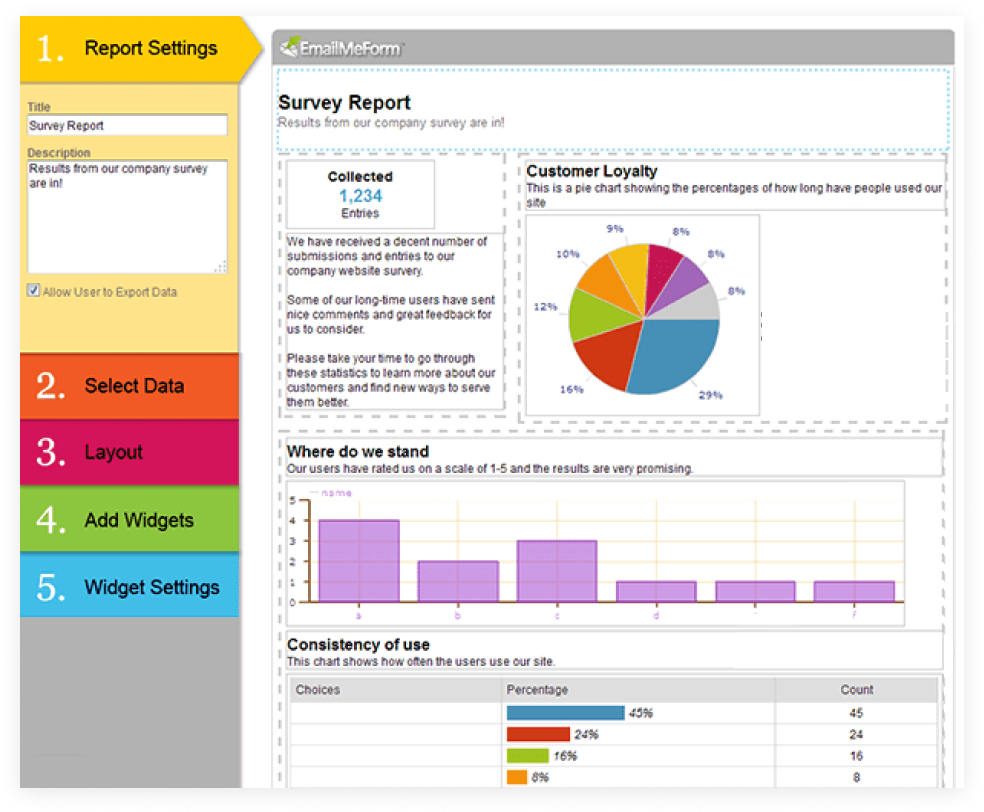
Report Builder enables you to display the collected data via visually attractive reports. Choose how you want which data to be illustrated whether in graph, charts, or data grid so you can easily present your findings with the team.
Make your reports look good
Own your form even up to data reporting. Personalize your form report to the theme of your preference. You can even use text widgets and HTML to customize your reports.
Share your report
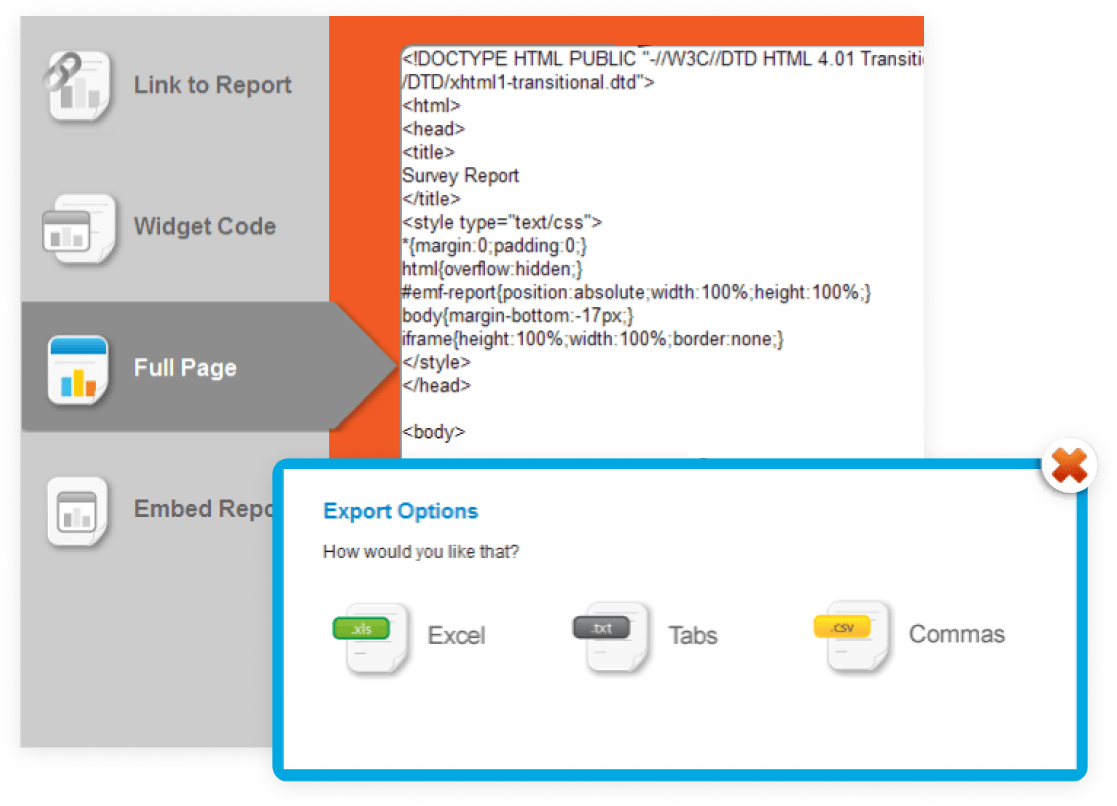
Readily share your report with the team by sharing HTML code or by embedding the link on different platforms. Export the entire presentation or select only some of the widgets from your report.